ui Designs
design process
Figma was utilised as the primary prototyping software for the creation of ‘Enny’. Specifically, the benefits of Figma revealed themselves in its plugins, prototyping methods, smart animations, transitions, key/gamepad interactions, horizontal & vertical scrolling and text input features. By leveraging its powerful design features and efficient workflow, these advantages were utilised to create the components and respective features of each page. A comprehensive guide to the design process is detailed below:
Loading screen
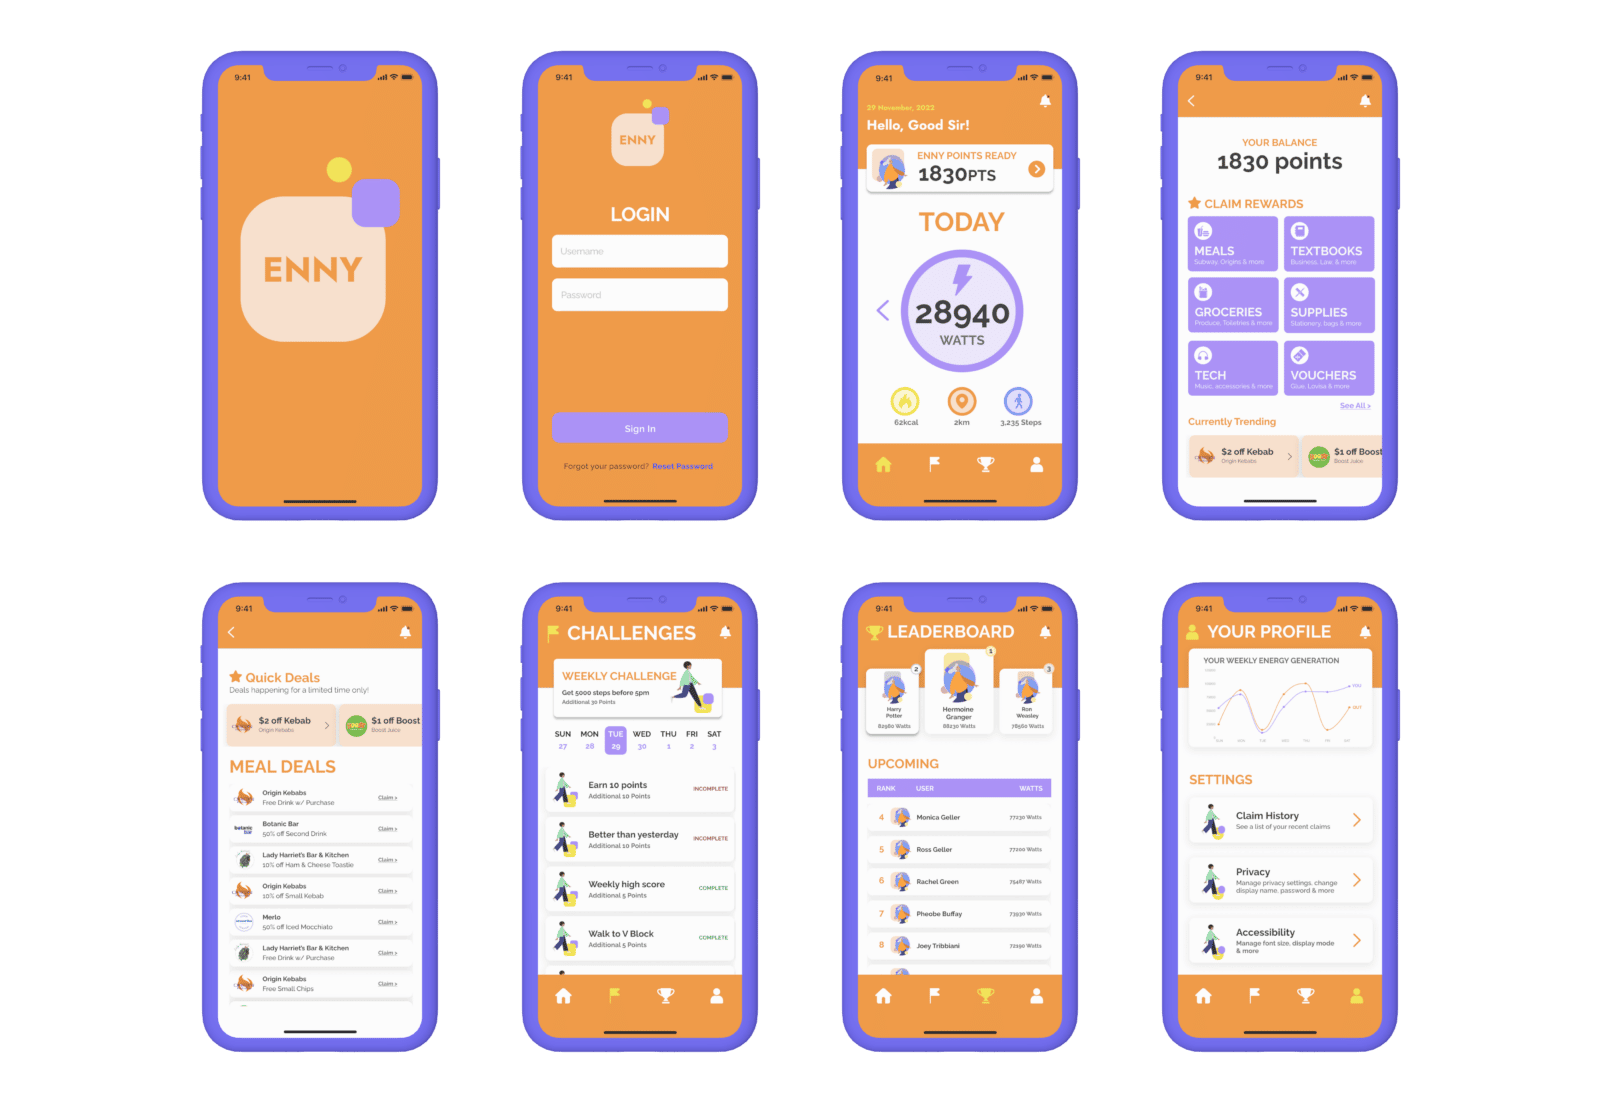
An animated ’Loading Screen’ was designed to be featured at the beginning of the application journey to invoke a sense of playfulness from the start of the user’s experience. To achieve this effect, a circle of color ‘#FAE2CE’ was placed behind the ‘Enny’ logo with a ‘Wipe’ transition applied to it. This would then be smart animated to a screen filled with the transition colour (#FAE2CE) to make it appear as though the circle is enlarging to transition into the next screen.
login page
The main features of the ‘Login Page’ are the username and password fields. Specifically, the use of key / gamepad interactions on the input components allowed the application to mimic that of a fully developed application, whereby a user inputs a username and password value into fields to successfully log in. For the ‘login’ input field, upon the keypress of the letter ‘d’, the component will be filled with the username “DesignCapstone2022”, while the keypress of the letter ‘p’ in the ‘password’ input field, generates a hidden password. Additionally, the use of delays on the pipe symbol creates a cursor to simulate the full typing effect.
home page
The home page consists of various elements of the application – a card to claim points, a graphical representation of the amount of energy generated, health tracking visuals and the navigation bar. Throughout the prototyping of this page, the most useful prototyping tool was utilising the interaction of navigating to a specific page when an element of the page is clicked. This was seen through the bell icon, which opens up the user’s outstanding notifications, the tracker, which allows users to view the amount of energy they have generated, and links to each major page of the application. Additionally, the resources such as the icons8 plugin and the noun project were utilised for their icons to further foster more intuitive design.
Claim Rewards, Challenges and Leaderboard Page
The aforementioned pages harnessed horizontal and vertical swiping to simulate how the app would be interacted with once fully developed. To do so, a series of components were grouped, framed then clipped to fit a specific portion of the application. Only then, once this was complete was horizontal/vertical overflow scrolling able to be applied. Additionally, the graphics on these screens were achieved by utilising the ‘Blush’ Figma plugin, which allows designers to create and customise illustrations by choosing a collection, picking a composition then placing it on the canvas. The specific collection ‘Humans’ was employed for its fun, playful and colourful graphics of people walking.
User profile page
The most outstanding element on the ‘User Profile’ page was the use of the ‘Chart’ Figma Plugin to allow a custom graph to be generated. This was utilised in the app to show the user’s Weekly Energy Generation compared to the average of all QUT students. Students are also able to access a wide range of settings to customise their application appearance and user experience.
see how it works


